
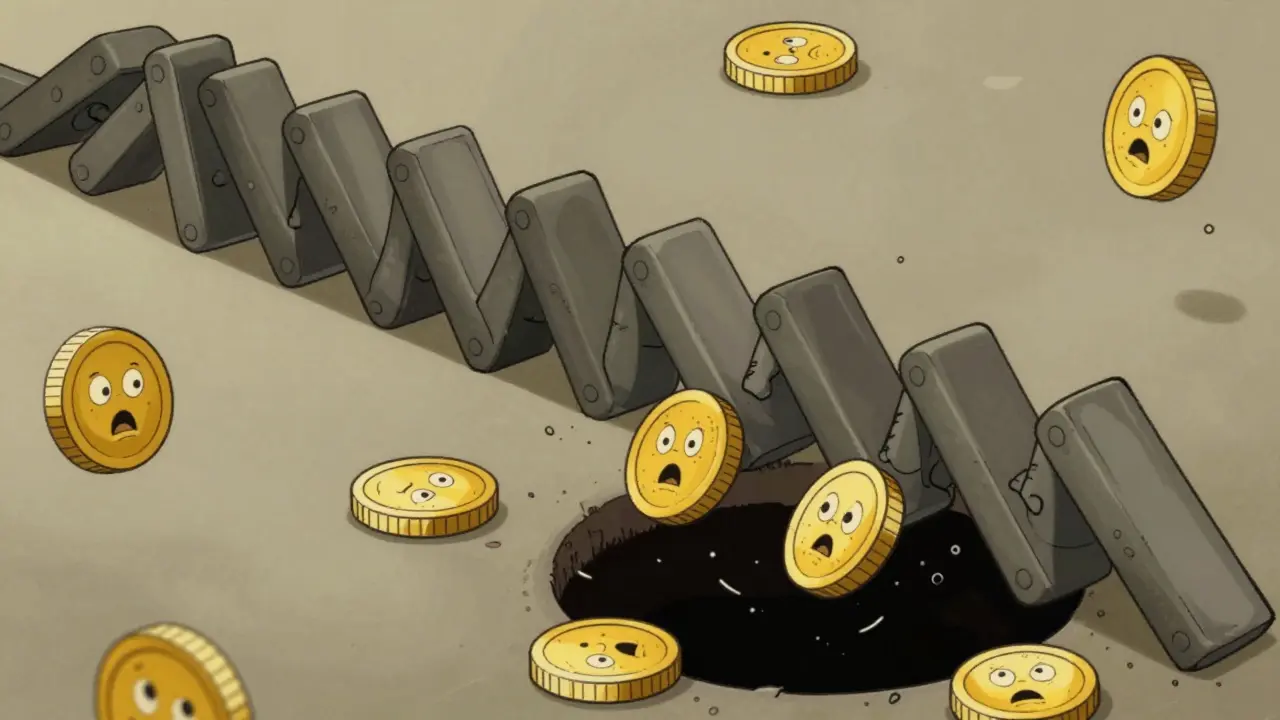
Imagine you are sitting at your computer, watching your Bitcoin position. The price drops 5%. Then 10%. Suddenly, it plummets another 20% in minutes, wiping out your account completely. You didn't panic sell. Your stop-loss didn't trigger. Something else happened. This is not bad luck. It is a cascade liquidation.
In cryptocurrency markets, this phenomenon is far more common and dangerous than similar events in traditional finance. A cascade liquidation is a self-reinforcing cycle where forced selling triggers further price drops, which then force even more selling. It is a domino effect that can erase billions of dollars in value within hours. Understanding how these spirals work is the difference between surviving a market crash and losing everything.
What Exactly Is a Cascade Liquidation?
To understand a cascade, you first need to understand leverage. When you trade with leverage, you borrow money to increase your position size. If you use 10x leverage, a 10% move against you wipes out your entire capital. To protect lenders, exchanges and protocols set a liquidation price. This is the point where your collateral (the money you put up) is no longer enough to cover the loan.
A single liquidation is just one trader getting kicked out. A cascade liquidation happens when many traders have their positions clustered at similar price levels. Here is the chain reaction:
- An external event (like bad news or a large sell order) pushes the price down slightly.
- This drop hits the liquidation threshold for thousands of leveraged long positions.
- The exchange or protocol automatically sells these assets to repay the borrowed funds.
- This massive, automated selling pressure drives the price down further.
- The lower price hits the next cluster of liquidation thresholds, triggering another wave of selling.
- The spiral accelerates until liquidity dries up or prices stabilize much lower.
This isn't theory. In May 2021, Bitcoin dropped from roughly $60,000 to $30,000 in days. A significant portion of that drop was driven by cascading liquidations across multiple platforms. More recently, in October 2023, the market saw nearly $19 billion in liquidations in a short period. These weren't organic shifts in sentiment; they were mechanical failures caused by too much leverage concentrated at specific price points.
Why Crypto Cascades Are Worse Than Stock Market Crashes
You might wonder why stock markets don't collapse this way. They have safeguards. Traditional financial markets operate during set hours and have circuit breakers. If the S&P 500 drops 7%, trading pauses for 15 minutes. This gives investors time to breathe, reassess, and prevents panic-driven algorithms from running wild.
Crypto markets never sleep. They run 24/7/365. There are no circuit breakers on most decentralized protocols or centralized exchanges. Furthermore, the leverage available is vastly different. In traditional finance, retail traders rarely get more than 2x or 3x leverage. In crypto, you can easily find 10x, 50x, or even 100x leverage on major exchanges.
| Feature | Traditional Finance (Stocks) | Crypto Markets |
|---|---|---|
| Trading Hours | Market hours only | 24/7/365 |
| Circuit Breakers | Yes (pauses trading) | Rarely (mostly none) |
| Max Retail Leverage | 2x - 3x | Up to 100x |
| Liquidity Depth | Highly distributed | Concentrated in few venues |
| Interconnectivity | Siloed institutions | Highly interconnected DeFi protocols |
Another critical factor is interconnectivity. In Decentralized Finance (DeFi), protocols like Aave, Compound, and MakerDAO often share the same underlying assets. If the value of Ethereum crashes, it affects collateral in all these systems simultaneously. During the Terra/Luna collapse in May 2022, this interconnectedness meant that a failure in one ecosystem triggered liquidations across dozens of other protocols, creating a systemic crisis rather than an isolated incident.
The Anatomy of a Crash: Real-World Examples
Looking at past events helps us see the patterns. Let's look at two major incidents.
The May 2021 Bitcoin Crash
Bitcoin was hovering near its all-time high of $64,000. Regulatory concerns from China and comments from Elon Musk about Bitcoin's energy usage sparked initial fear. But the real damage came from leverage. Traders had piled into long positions with high leverage. As the price dipped below $60,000, the first wave of liquidations hit. This selling pushed the price to $58,000, triggering the next wave. Within 48 hours, over $28 billion in leveraged positions were liquidated. The price bottomed near $30,000 before recovering. Most of that drop was mechanical, not fundamental.
The October 2023 Liquidation Event
In October 2023, the market experienced a sudden shock that led to approximately $19 billion in liquidations. According to data from CoinShares, this was largely driven by cross-asset collateral issues. Many users had borrowed stablecoins using volatile assets as collateral. When those asset prices slipped, the automatic liquidation engines sold them off. Because there wasn't enough buy-side liquidity to absorb the sales, slippage increased by over 300% on some assets. Users who thought they were safe found their positions liquidated at prices far worse than expected due to this lack of depth.
How to Protect Yourself from Cascade Liquidations
You cannot control the market, but you can control your exposure. Here are practical steps to survive a cascade.
1. Use Lower Leverage
This is the golden rule. High leverage sounds attractive because it amplifies gains, but it also amplifies risk. If you use 10x leverage, a 10% move against you means zero equity. In a volatile market, 10% moves happen daily. Stick to 2x or 3x leverage if you must trade derivatives. For most retail traders, spot trading (buying and holding actual assets) is safer because you cannot be liquidated unless the asset goes to zero.
2. Monitor Liquidation Heatmaps
Tools like Coinglass and Hyblock provide liquidation heatmaps. These visual tools show you where large clusters of liquidations are waiting. If you see a bright yellow band at $65,000 for Bitcoin, it means thousands of longs will be liquidated if the price hits that level. Avoid placing your own positions near these zones. Instead, consider setting your entry points away from these clusters to reduce the chance of being caught in the initial sweep.
3. Maintain Higher Collateralization Ratios
If you are lending or borrowing in DeFi, do not hover near the minimum collateralization ratio. If a protocol requires 150%, aim for 200% or higher. This buffer gives you room to breathe during normal volatility. During a cascade, prices can gap down significantly. A 20-30% buffer above the minimum requirement can mean the difference between keeping your assets and losing them to liquidation penalties.
4. Understand Slippage Risk
In thin markets, your stop-loss orders may not execute at the price you expect. During a cascade, liquidity evaporates. If you try to sell $10,000 worth of an altcoin during a crash, you might only get half that value because there are no buyers. Be aware that "paper losses" can become real very quickly when order books are empty.
5. Diversify Across Protocols and Assets
Don't keep all your eggs in one basket. If you use DeFi, spread your collateral across different chains and protocols. If you hold crypto, diversify beyond just Bitcoin and Ethereum. While correlation is high during crashes, having assets that react differently can help cushion the blow.

Future Solutions: Circuit Breakers and Smart Safeguards
The industry is learning from these painful events. New technologies are emerging to mitigate cascade risks.
Chainlink Price Feeds introduced version 2.0 with "circuit breaker" functionality. This feature allows DeFi protocols to pause price updates if they detect extreme volatility (e.g., a 15% move in 5 minutes). This pause gives the market time to find equilibrium before liquidations proceed, preventing the spiral.
Major exchanges are also adapting. Binance implemented "liquidation smoothing" in early 2024. Instead of dumping all liquidated assets onto the market at once, the system staggers sales over five-minute intervals. Internal metrics suggest this reduced price impact by 27% during recent volatility events.
Regulators are taking notice too. The U.S. Commodity Futures Trading Commission (CFTC) has proposed rules requiring exchanges to implement specific liquidity safeguards. While regulation moves slowly, the pressure is mounting for platforms to prioritize stability over raw volume.
Conclusion: Respect the Mechanics
Cascade liquidations are not random acts of God. They are predictable outcomes of human behavior combined with algorithmic execution. Traders pile into leverage, cluster their exit points, and ignore liquidity depth. When the music stops, the math takes over.
By understanding the mechanics, monitoring heatmaps, and using conservative leverage, you can navigate these storms. Remember, the goal isn't to predict every crash. The goal is to ensure that when a crash happens, you are still in the game.
What causes a cascade liquidation in crypto?
A cascade liquidation is caused by a feedback loop. An initial price drop triggers the forced sale of leveraged positions. These sales add downward pressure to the price, causing it to drop further. This new low triggers more liquidations, creating a spiral that accelerates until liquidity is exhausted or prices stabilize.
How can I avoid getting liquidated during a market crash?
To avoid liquidation, use lower leverage (2x-3x max), maintain a collateralization ratio well above the minimum (aim for 20-30% extra buffer), and monitor liquidation heatmaps to avoid placing positions near crowded liquidation levels. Spot trading is also a safer alternative to leveraged derivatives.
Why are crypto liquidations worse than stock market margin calls?
Crypto markets operate 24/7 without circuit breakers, allowing panic to spread continuously. Additionally, crypto offers much higher leverage (up to 100x vs 2-3x in stocks) and has thinner liquidity, meaning large sell orders can cause drastic price swings that trigger more liquidations rapidly.
What is a liquidation heatmap and how do I use it?
A liquidation heatmap is a visual tool that shows price levels where large amounts of leveraged positions are likely to be liquidated. You can use it to identify risky zones. Avoid opening new leveraged positions near these hotspots, as price movements often target these areas to trigger liquidations.
Do DeFi protocols have protections against cascades?
Some newer DeFi protocols are implementing safeguards like circuit breakers via Chainlink Price Feeds, which pause trading during extreme volatility. Others use dynamic collateralization ratios that increase requirements as volatility rises. However, many older protocols still lack these features, so users must check protocol documentation carefully.

10 Comments
Nick Rice
Listen up, because I am only going to say this once. You think you are safe with your stop-losses? Wrong. The market does not care about your feelings or your technical analysis charts. When the cascade starts, liquidity vanishes faster than you can blink. I have seen accounts wiped out in seconds while people were still typing 'why is this happening' on Discord. It is brutal and it is efficient. You need to respect the mechanics of leverage or get crushed by them. There is no middle ground here. If you are trading with more than 3x leverage, you are essentially gambling with someone else's money and hoping the house doesn't notice. Stop pretending you are a trader if you cannot handle a 10% drop without getting liquidated. It is simple math, not magic. Wake up.
Grace Newman
This entire narrative is a carefully constructed illusion designed to keep you compliant. They want you to believe that these crashes are 'mechanical failures' so you do not question who is pulling the strings. Have you ever considered that the circuit breakers in traditional finance exist precisely to protect the institutions from the very volatility they create? In crypto, the lack of regulation is not an accident; it is a feature. The interconnectedness of DeFi protocols is not a bug; it is a trap. They feed on your collateral. Every time you see a heatmap, remember that it is being watched by entities that can manipulate those clusters at will. Do not trust the tools. Trust nothing but cold storage and zero leverage. The system is rigged against the retail participant from day one.
Annemarie Fitzgerald
i mean like... isnt this just the universe showing us that we cant control anything?? its funny how we try to put numbers on chaos. the spiral is just nature taking back what was borrowed. i lost my shirt in may 2021 and honestly it felt like a spiritual cleansing lol. maybe if we all just held spot and meditated the cascades would go away. but no we gotta use 100x leverage because we are greedy little mortals. the heatmaps are just horoscopes for degens. who really knows what price is real when the order book is empty? it is all fake anyway. just vibes.
Abby Sivertsen
I feel for everyone who has been burned by this. It is genuinely heartbreaking to watch people lose their life savings because of automated systems that have no empathy. We need to talk more about the psychological toll this takes on traders. It is not just about money; it is about the stress and anxiety that comes with watching your portfolio evaporate in real-time. I have friends who stopped trading entirely after the Luna crash because they couldn't handle the fear anymore. Let us be kinder to each other in these threads. Share your stories so we can learn together. Support is key. We are all in this chaotic space together and we need to look out for one another instead of just blaming 'leverage'. It is a human issue, not just a technical one.
Benjamin Eisen
hey guys i just wanted to add that i found some cool tools that help with this stuff. i know i type bad sorry about that. but seriously checking the liquidation heatmaps is super helpful. i used to get wrecked all the time but now i just stay away from those yellow zones. it makes me feel safer knowing where the danger is. also using lower leverage is key i think. i stick to 2x max now and sleep much better at night. hope this helps someone out there who is struggling like i was. let us keep learning and growing together!
Kenneth Riley
you people are absolutely delusional if you think any of this advice will save you from the inevitable collapse. the entire crypto ecosystem is built on sand. every time you read about 'circuit breakers' or 'smoothing' you are reading about band-aids on a bullet wound. the smart money knows this and they are shorting everything in sight. why do you think the volume is drying up? because the whales are exiting. they do not need heatmaps to know when to sell. they own the exchanges. they control the narratives. stop listening to these self-proposed experts and start looking at the actual on-chain data which shows massive accumulation by entities that have already profited from your losses. it is over for the retail speculator. accept it.
ravi mahla
Haha wow, serious stuff! But hey, isn't it fun riding the rollercoaster? I mean, sure, you might lose everything, but at least you get a good story to tell at parties, right? Or do you even have parties if you're too busy staring at charts? Just kidding (mostly). The real joke is thinking you can predict the unpredictable. The market laughs at your stop-losses. Embrace the chaos, my friends! If you survive, you win. If you don't, well, there's always next cycle. Keep smiling through the pain!
Mark Brunschwiler
I am tired. So tired. Why do we keep doing this to ourselves? We chase the highs and then cry when the lows come. It is a cycle of pain and regret. I just want to feel something real but all I feel is the drain of my bank account. The numbers go down and my soul goes with them. Is there any joy left in trading? I do not think so. It is just fear and greed eating us alive from the inside out. I miss the days when money meant something tangible. Now it is just pixels on a screen that disappear when the algorithm decides to punish you. It hurts so much.
Sonya O'Brien
I completely agree with the sentiment expressed here regarding the importance of understanding the underlying mechanics rather than just reacting emotionally to price movements, and I think it is crucial that we consider the broader implications of these systemic risks on the overall stability of the financial landscape, especially when we factor in the increasing interconnectivity between traditional finance and decentralized protocols which creates a complex web of dependencies that can amplify shocks in ways that are difficult to predict or mitigate effectively without robust regulatory frameworks and technological safeguards that are currently lacking in many jurisdictions, so perhaps we should focus on advocating for greater transparency and accountability within these platforms while also educating ourselves on risk management strategies that prioritize capital preservation over speculative gains, because ultimately the goal should be sustainable participation in the market rather than chasing quick profits that often lead to devastating losses during periods of high volatility, and I believe that by fostering a community that values long-term thinking and prudent decision-making we can create a more resilient ecosystem that is better equipped to withstand the inevitable ups and downs of the crypto asset class.
Akeem Whittaker
The point about slippage is critical and often overlooked by beginners. When liquidity dries up, your exit strategy becomes irrelevant. You cannot escape a fire if the doors are locked. This is why monitoring depth charts is as important as price charts. Many traders focus solely on entry points and ignore the reality of exiting large positions. The market makers know exactly where the stops are clustered and they hunt them. It is a predatory environment. You must approach it with caution and discipline. Do not rely on luck. Rely on data and conservative position sizing. The ones who survive are not the smartest; they are the most disciplined. Learn from the mistakes of others. Do not repeat them.